Each scan is interpreted differently. Click below to learn how to interpret the data file for regular box counting.

The Data File

This page helps you sort out the information in the data file. If you need to learn how to set up a scan and get a data file in the first place, click here.The data file has three main parts: summarized data, slopes, and data by box size. It lists information according to grid orientation. There is always only one row of slopes, and as many rows in the bottom as there are box sizes. However, if there was only one orientation in the scan, then there is one row in the top, and one column for each parameter in the bottom; otherwise, if there are G grid orientations, there are G rows in the top, and G columns for each parameter in the bottom.

Click on one of the three major parts of the screen shot of a data file below, or scroll down to read the listings.
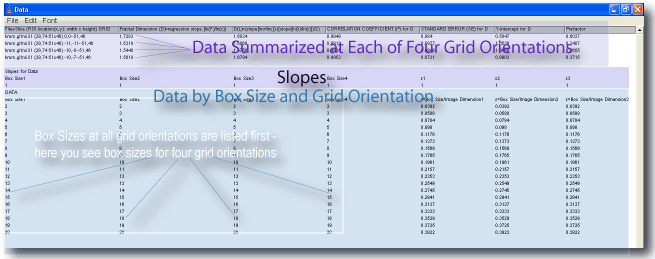
TOP of the file

Data Summarized at Each Grid Orientation

The column headings across the top part of the file are explained in this section.

File+Slice (ROI location(x,y): width x height) GRID

A description of the image and the area that was scanned at this location; details are explained in the tutorial

Fractal Dimension (D)=regression slope [ln(F)/ln(ε)]

Each row lists the DB at one grid position or orientation, calculated from the regression line for the count of boxes containing foreground pixels (F) and scale (ε). See the tutorial for more.

D(L)=(slope[lnσ/lnε])-((slope[ln(λ)/ln(ε)])/2)

See .

CORRELATION COEFFICIENT (r2) for D

r2 for the regression line for the DB

STANDARD ERROR (SE) for D

standard error for the regression line for the DB

Y-intercept for D

The y-intercept for the regression line for the DB

Prefactor for D

The prefactor from the regression line for the DB

Smoothed (Biggest) D

See smoothed DB in the glossary

r2

Correlation coefficient squared for the regression line from the smoothed DB

SE

Smoothed (Smallest) D

See smoothed DB in the glossary

r2

Correlation coefficient squared for the regression line from the smoothed DB

SE

Standard Error for the regression line for the smoothed DB(small)

Λ=(Σ[Fλ])/Number of Box Sizes

The average λ (lacunarity) for this grid orientation, taken over all εs. See Interpreting Lacunarity

Variation in Λ=(σ/μ)

The relative variation in lacunarity over all box sizes for this grid orientation, calculated as the cv from the standard deviation ÷ the mean for the values of lacunarity over all box sizes

Λ=(Σ[Eλ])/Number of Box Sizes

The average Eλ (empties lacunarity) for this grid orientation, taken over all εs. See Interpreting Lacunarity

σ/μ

The relative variation in empties lacunarity over all box sizes for this grid orientation, calculated as the cv from the standard deviation ÷ the mean for the values of lacunarity over all box sizes

Λ=(Σ[FBPDλ])/Number of Box Sizes

Lacunarity calculated using a binned probability distribution.

σ/μ

The relative variation in BPD lacunarity over all box sizes for this grid orientation, calculated as the cv from the standard deviation ÷ the mean for the values of lacunarity over all box sizes

Λ=(Σ[EBPDλ])/Number of Box Sizes

The average EBPDλ (BPD lacunarity calculated using the empties count) for this grid orientation, taken over all εs. See Interpreting Lacunarity

σ/μ

The relative variation in Empties BPD lacunarity over all box sizes for this grid orientation, calculated as the cv from the standard deviation ÷ the mean for the values of lacunarity over all box sizes

σ/μ for count of boxes containing foreground pixels (F)

The relative variation or CV for the count over all box sizes for this grid orientation.

σ/μ for count including empty boxes (E)

The relative variation in Empties lacunarity over all box sizes for this grid orientation, calculated as the cv from the standard deviation ÷ the mean for the values of lacunarity over all box sizes

(σ/μ)/(σ/μ) for F/E

The ratio of the CV for the foreground count over the CV for the empties count. See F/E in the glossary

Box Sizes for Smoothed (Biggest) D

See Smoothing filters

Box Sizes for Smoothed (Smallest) D

See Smoothing filters

SLOPES

The middle part of the file lists slopes for the data columns for a grid orientation against their respective column for ε. That is, each slope is for the column heading directly below it and the column of εs which has listed in its heading the same number for grid location.

The Data

The bottom part of the file lists data for each box size. Beside each heading is a number (:1, :2, :3 etc.) for matching it with the relevant grid orientation.

Box Size

The size of the boxes or the grid calibre for this scan

ε=Box Size/Image Dimension

Scale calculated from box size ÷ Image Dimension

F=boxes containing foreground pixels

The total number of boxes at this size that contained any foreground pixels

E=all boxes, including empties, on image

See empties count

=mean mass

The average number of foreground pixels per box from all boxes that had any foreground pixels at this box size for this grid orientation

=standard deviation of mass

The standard deviation of pixels per box at this box size

Fλ=1+(σ/μ)2

Lacunarity at each ε calculated from σ and μ for foreground pixels per box (i.e., the CV2 for pixel mass)

Eμ=mean mass including empties

See empties

The standard deviation found using the empties count.

Eλ=1+(σ/μ)2

Lacunarity calculated using empties at each ε; See the empties count.