Sliding box lacunarity assesses heterogeneity.

This page is a practical reference for sliding box lacunarity scans. That's a bit of a mouthful to say, so we'll go with SLAC.

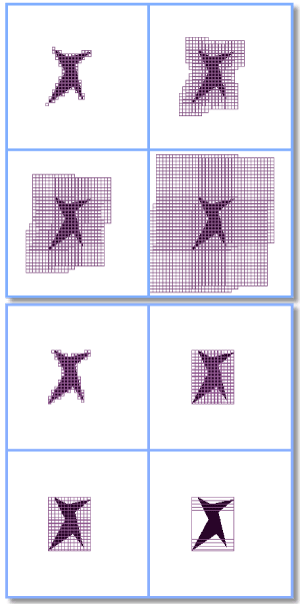
SLAC: , Sλ, SΛ, SΛac Some synonyms you might have seen for SLAC are listed in the box—all mean to say that, as illustrated in the image, something was sliding during box counting sampling.

The preceding S in SLAC distinguishes how the data were gathered for the lacunarity discussed here; if you do not want to know about sliding box lacunarity, try , , , or BPDλ.

This page assumes you are familiar with the basics of using FracLac, lacunarity, and sliding box scans, and that you want to learn what the options or results are about.


Tips

Exhaustive vs Nonexhaustive Scanning

    Setting it Up:
  • To use a nonexhaustive scan, set the slide factors, x and y, greater than one (e.g., 5).
  • To use an exhaustive scan, set the set the slide factors, x and y, to 1.

Using a nonexhaustive scan often yields the same basic results as an exhaustive scan, and is especially useful for preliminary quick analyses. An exhaustive scan slides the sampling element one pixel at a time, and overlaps fully, whereas a nonexhaustive scan moves in larger increments, overlapping the sampling elements less but taking less time. (See sliding box sampling for further information about sliding box scans.)


Options

Options Panel
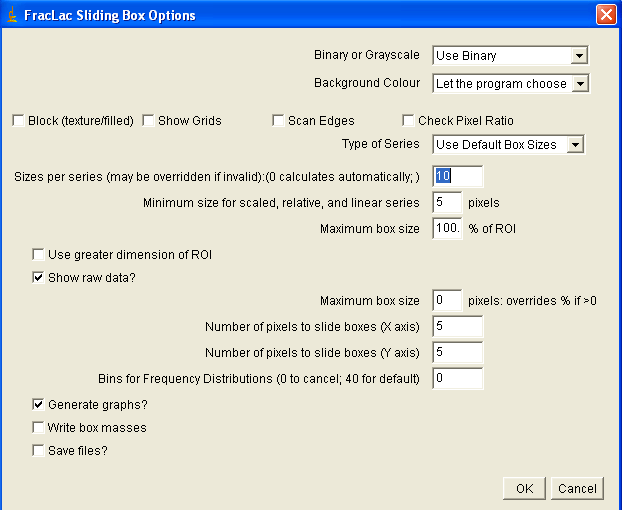
Options List

Save

Save files automatically instead of showing them on the screen.

Write Box Masses

Generates a file of data showing, as illustrated here, the number of pixels at each box that was slid over the image. These are the basic data from which lacunarity is calculated. Files from scans have many more values per ε than for fixed grid scans.

Generate Graphs

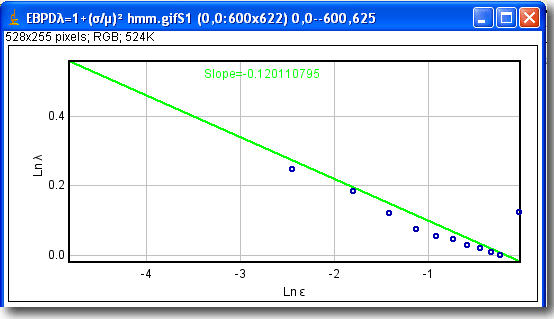
Select this option to generate graphs showing the data and regression lines for lacunarity and ε; the data are available in the results files

Block Texture

See general explanation of this option in BC

Bins

See general explanation of this option in BPD

Amount to Slide (Y)

The amount of pixels to move the sampling box vertically after each count of pixels. See Tips.

Amount to Slide (X)

The amount of pixels to move the sampling box horizontally after each count of pixels.

sliding box sampling
exhaustive sampling tip.

Show Raw Data

Generates a file showing the count and summaries at each ε; this file is provided for comparison to fixed scan box counts

Use Greater

See general explanation of this option in BC

Maximum Box Size in Pixels

See general explanation of this option in BC

Maximum Box Size Percent

See general explanation of this option in BC

Minimum Box Size

See general explanation of this option in BC. Tips: It is important in some cases to keep the minimum resolvable size (i.e., minimum grid size in pixels) high enough (e.g.,usually greater than 3). Setting this option very small can increase processing time dramatically because of the overlapping during sampling.

Sizes per Series

See general explanation of this option in BC

Type of Series

See general explanation of this option in BC

Background

See general explanation of this option in BC

Binary (or Grayscale)

See general explanation of this option in BC

Check Pixel Ratios

See general explanation of this option in BC

Scan Edges

Select this option to scan the edges of an image, as shown in the figure below, which shows the option selected and unselected.

Show Grids

Generates a stack of images showing grids used. This is useful for showing how changes in the sliding X and Y increments affected sampling.

Grid Generating Tutorial

Results File

Every Sliding Box scan has a results file generated by default, called the FracLac Sliding Box Lacunarity Results file.

file/slice/roi

The first column of this file lists information about the image then some stats.

The fractal dimension calculated there is the slope of the ln-ln regression line from the average pixels per box and ε (its r2 is also reported). The DF will generally be different from a regular DB, because of differences in sampling using sliding box scanning.

The inverse of the prefactor and y-intercept for that equation are also reported, as general measures of lacunarity, but note that other measures are also listed in this file.

The first column also lists the X and Y sliding values used for sampling.

Slopes

The last row in the first column is the label for slopes of data reported in the remaining columns in the file against ε, which is reported in the third column, beside box size in the second. These slopes are reported on graphs when the option to generate graphs is selected.

Box Size

The second column lists the box sizes in pixels. The third shows each ε, based on the ratio of box size to image dimension from the sliding scan

Mean foreground pixels per box

The 4th column lists μ, the average foreground pixels per box from the sliding scan, and the 5th column lists the standard deviation, σ for pixels per box. Note that these values contrast with those in the columns for the empties count.

Boxes Containing Foreground Pixels

The 6th column lists the number of times the box had any pixels in it when slid across the image using the size and X,Y sliding values selected.

Fλ = 1+lacunarity

The column labeled "Fλ = 1+(σ/μ)2 is the value for λ or lacunarity calculated from a sliding scan.

Mean Image pixels per box

The mean or μ image pixels per box refers to the empties count using a sliding scan. Beside the μ image pixels is σ, the standard deviation for that value.

Total Boxes

This is the number of times the box of the corresponding size moving X and Y pixels at a time was laid on the image to take a sample.

Eλ = 1+lacunarity

The column labeled "Eλ = 1+(σ/μ)2 is the value for Eλ or Elacunarity calculated from a sliding scan.

BPD

See the binned probability distributions page for columns with "BPD" in the label.