Lacunarity is heterogeneity, a concept explained and, better yet, illustrated in the background section for lacunarity. How do the numbers that FracLac returns reflect the concept?
First things First
We need to get one thing out of the way up front here. You have to know where to get the numbers for lacunarity that are discussed on this page. If you arrived here from a section on interpreting results in general, you already know that you get them from a Standard Box Count Scan, Sub Scan, Multifractal Scan, or a Sliding Box Lacunarity scan. Lacunarity results are reported in the various graphics, results files (e.g., the FracLac Results file, which appears with Standard Box Count scans), and data files (e.g., the Standard Box Count Data file, which appears only if the "Show Data" option is selected when you scan). Results from the SLAC scan we can talk about here.
Per Box Size
What information can you get about lacunarity from these files?
Lacunarity is generally based on the pixel distribution for an image, which we get from scans at different box sizes at different grid orientations:
-
The most basic number for lacunarity,
λ,
is
λε,g
= CV2ε,g
=(σ⁄μ)2ε,g
where
σ
is the standard deviation and
μ is the mean for
pixels per box at this
size, ε, in a
box count at this
orientation,
g. To locate λ, look in the
Data file
where it is recorded per ε and per g.
-
Because
λ∝ε,
there are many λs to deal with in the data
file. λs and any other data from a box
count are in sets of columns for each
grid, g,
in the lower part of the file. Each g has
a column for each value, with a row for
each ε. So, if there were 3 gs, you will
see 3 columns of, for instance, σ
labeled as σ: 1, σ: 2,
and σ: 3, with rows corresponding
to each ε listed at the far left
of the file (but not shown in this image).
-
Individual λs are in columns
labeled "Fλ
=1+(σ/μ)2"
(this is the same as Fλ=1+λ)
The F stands for
Foreground
pixels,
and signifies lacunarity calculated using the
count of foreground pixels independently of
other considerations.
-
In this regard, you may have noticed column
headings that look like variations on Fλ
in the data file. These are treated essentially
the same as Fλ, and the same general ideas
apply to finding and interpreting them;
the differences lie in how the data were treated.
That is, the calculations were made from a binned
probability distribution for values with
BPD in their names, and taking into
account empty boxes
encountered in a scan for values with
E in their names. You can read
their definitions in the glossary using
these links:
- Binned Probability Density Lacunarity (FBPD and EBPD)
- Eλ
-
Individual λs are in columns
labeled "Fλ
=1+(σ/μ)2"
(this is the same as Fλ=1+λ)
The F stands for
Foreground
pixels,
and signifies lacunarity calculated using the
count of foreground pixels independently of
other considerations.
-
Because
λ∝ε,
there are many λs to deal with in the data
file. λs and any other data from a box
count are in sets of columns for each
grid, g,
in the lower part of the file. Each g has
a column for each value, with a row for
each ε. So, if there were 3 gs, you will
see 3 columns of, for instance, σ
labeled as σ: 1, σ: 2,
and σ: 3, with rows corresponding
to each ε listed at the far left
of the file (but not shown in this image).
Over All Sizes
- All of the λs from looking at our image using
one orientation of a series of grid calibres can be
summarized in two ways, as a slope and as a mean.
-
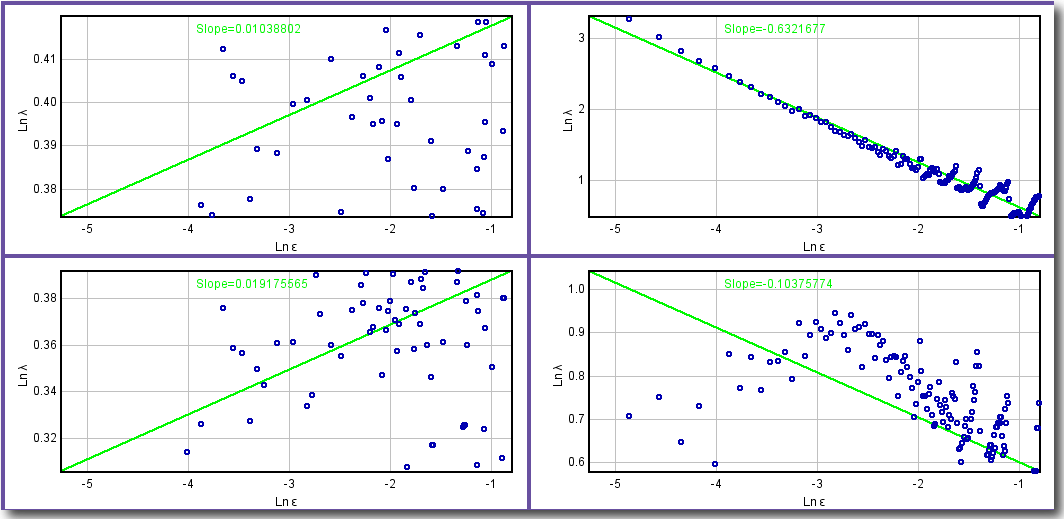
We can look at the slope
of the ln-ln
regression
line of Fλ over all ε.
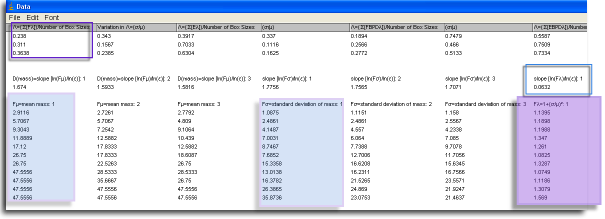
- To locate the slope in the data file, see the screen shot. The slope is boxed in a blue outline at the far right of the screen shot, which corresponds in the file itself to being listed above each column for Fλ=1+λ for each g.
-
To see how
λ∝ε
graphically, before scanning, select
Graph Lacunarity
to generate
graphs
of the data and the regression line labeled
with the slope.
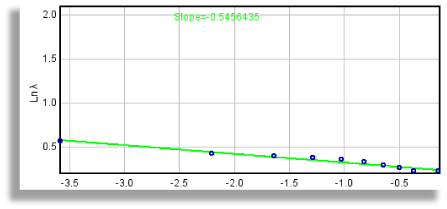
- Why use Fλ= 1+(σ⁄μ) 2=1+λ? The slope for each g is calculated using this transformation because of an "undefined" calculation. A completely homogeneous image will not vary in the pixels per box, so that the standard deviation, σ, for a box count at some ε will be 0. This means that λ = (σ⁄μ) 2 = 0, which makes sense, but it also means that the ln of λ and therefore the slope of the ln-ln regression line for λ and ε would be undefined. Thus, we transform the data using λ+1, so that a completely homogeneous image has a slope of 0, corresponding intuitively to the idea of no rotational or translational invariance and no gaps.
-
To put heterogeneity from one perspective and
one series of grid sizes into an average, the
mean (λ or
Λ)
from all ε sized boxes at a grid
orientation, g, is calculated
- Λg = [Box SizesΣ b=1λε (b)] ÷ Box Sizes.
-
To locate this summary value in the Data file,
check the top rows. Find the
grid orientation you want from the first column,
then follow that row to the column heading
for the particular type of Λ you need,
in this case "F" at the top part of the data file
(see Λ in the screen shot of part of a
data file, outlined in purple).
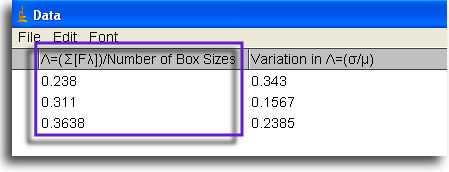 .
Beside that value you can find the CV2,
also, which describes some of the relative variation
in Fλ over all ε.
FracLac does not calculate the mode
and median but these can be found readily by
importing the data file into a spreadsheet
and calculating these from the appropriate
columns.
.
Beside that value you can find the CV2,
also, which describes some of the relative variation
in Fλ over all ε.
FracLac does not calculate the mode
and median but these can be found readily by
importing the data file into a spreadsheet
and calculating these from the appropriate
columns.
-
We can look at the slope
of the ln-ln
regression
line of Fλ over all ε.
Over All Orientations
- To put all of your heterogeneity in one place and
distill into one number the lacunarity over all
of the grid orientations used to investigate an
image, you have two options, both of which are
found in the FracLac Results File from
fixed grid
scans only:
-
The broadest
value for lacunarity is
Λ,
which summarizes data over all
grid orientations - it is
the mean of the means for an image.
- To find it: look in the FracLac Results file under the appropriate heading, in this case, "Lacunarity =L(F (foreground mass)) =(Σ[FΛ])/Grids"
- To calculate it: Λ =[Grids Σg=1 Λg]÷Grids where Λg is from the equation above.
- Another summary value is
PΛ
or "Prefactor Lacunarity",
which measures variation over grid
orientations in a
standard scan
with multiple locations.
- To find the results for PΛ, locate in the Results file the mean y-intercept lacunarity for box counts and for pixel masses along with the mean y-intercept.
- Be aware that, according to the equation below, PΛ=0 if there is only 1 grid location, which reflects not that there is no variation but that no variation was assessed.
- This statistic uses the prefactor A from the scaling rule N=AεD B, where Ag = the prefactor calculated from the y-intercept for the ln-ln regression line for ε and either count or mass at grid g, where G = the number of grid locations. The prefactor, A, is affected by the way data are gathered and especially by the lower limit of box sizes used.
- To calculate PΛ: Ag= 1/(e y interceptg) A = [G Σg=1Ag ]⁄GPΛ= GΣ g=1[[{Ag/ A}-1]2]/G
-
The broadest
value for lacunarity is
Λ,
which summarizes data over all
grid orientations - it is
the mean of the means for an image.